
Saturday, August 27, 2011
Google can't tell time
I was looking at the stats for this blog and noticed something strange, the time scale started with 2009 May, but the blog didn't exist until 2010 March. It seems Google, and more specifically Blogger, uses a really odd calendar for their stats page. Looking at the all time overview the graph starts with 2009 May and then transitions as expected to 2009 August. At this point it shows the next month is 2010 September. See the screen capture below to see what I'm talking about:
 So everyone get ready, New Year's Day is this coming Thursday. I'm curious to see if the mistake is consistent and it shows next month as 2012 September. The 2012 apocalypse could be sooner than we thought.
Changes in sea level
One of the downsides to having a PhD is that my relatives have no idea what it is I do. For some it seems that having a PhD means that I am a "scientist" with expertise in anything that could be lumped under the term science. My degree is actually in computer science and then I specialized in a narrow subset of that field. From there I went into industry to work on projects that are only vaguely related to my dissertation. My general point though is that I don't have any particular expertise in other scientific fields. I do have an interest and read some books intended for laymen, but that doesn't mean I'm an expert on those topics.
A number of my relatives have recently taken an interest in global warming and wanted my opinion on the matter because I was the "scientist" in the room. My general answer is to just point to the scientific consensus and state that I provisionally accept it without being aware of all of the details. The EPA provides a summary of evidence for climate change and in particular a page describing the current state of knowledge. This put me at odds with them suggesting that global warming is some sort of conspiracy and that there is no real evidence. I couldn't really tell whether they disagree that the earth is warming or whether they just disagree that human activity is causing or at least contributing to it. The only thing that really seemed consistent in their arguments was the certainty that they were right and that nothing needed to be done to rectify the situation. Of course, I lost the debate because my typical retort was "I don't know." I haven't spent much time looking into global warming so I'm not that well versed on the evidence to support it.
Anyway, there were a number of questions that came up and for my own curiosity I wanted to know the answer. For this particular post, the question I want to look at is: what do we know about changes in the sea level? This question comes up in the context of global warming because melting ice sheets lead to an increase in sea level. My relatives were interested in the doom and gloom reports, but the numbers that caught my eye were the rate of increase since the 1960s:
The answer is the tide gauge. Tide gauges are cool because of the simplicity of the basic mechanism. It is essentially a big pipe with a hole below the sea level to allow water in. The pipe protects the water inside from all of the normal disturbances on the surface such as waves. As the name suggests it will still vary with the tides, but it allows fairly accurate measurement of the high and low tides. If you record this for a long enough time you could work out the average sea level for the location of the gauge as well as how this has changed over time. Place enough of these devices around the world and keep track of the measurements and you can figure out the average global sea level and if there are any discrepancies across the world.
The next obvious question is: with such a simple device how much tide history do we have? Humans have had the technology to make such a device for a long time, especially if you allow for manual measurement instead of various automated schemes that seem to have been developed in the mid to late 1800s with Kelvin's tide gauge. The Permanent Service for Mean Sea Level (PSMSL) has a page listing various long term records with the oldest being from Amsterdam starting in the year 1700. They also provide the data with sea level values relative to the NAP (a fixed reference level frequently used in Europe):
From this data set there is a clear rise in mean sea level starting in the 1800s. The PSMSL site also lists data from Stockholm over the period 1774 to 1984. Does it show the same trend? At first glance the answer is no:
What is going on? How could this record be so different? The explanation I found was from a paper Swedish Sea Level Series - A Climate Indicator and the reason is because the land is rising. Specifically this is known as post-glacial rebound (although glacial isostatic adjustment seems to be the preferred term now) and the land is slowly rising after being depressed by the weight of huge ice sheets that covered the region in a previous ice age. To figure out what the sea level has done we need to remove the trend caused by the rising land. Post-glacial rebound can vary from place to place, e.g., see the paper Measuring Postglacial Rebound with GPS and Absolute Gravity that looks at four sites in North America. That doesn't help me for determining the rate for Stockholm Sweden though. I couldn't find a good data set for showing what the rate of the land rise is, and the sources I read suggest it varies over time. The Swedish Sea Level Series paper mentioned earlier shows a trend, but it isn't clear to me what source they used for the rate. Various sources I have seen suggest the rate is less than 1cm per year now, one example is the description of the lake Mälaren. If I assume a rate of 5mm per year and generate a trend the output looks close to what the Swedish report is showing:

There is also a data provided for Liverpool. For this data set there are two versions: an annual MHW and adjusted MHW. For those that are not aware, MHW is the mean high water measurement. The adjustment is supposed to be described in the associated paper, but I could not find a version of the paper for free online so I don't know exactly what was done. I included both in the graph:

Both the annual and adjusted MHW show that the MHW level is rising. The adjusted value at a slower rate than the raw annual reading, in particular for older measurements. A 2008 paper uses these sources to show a trend in mean sea level from 1700 to 2000. The general trend is that mean sea level has been increasing for the last 200 years.
So what does this tell us? The three data sets being checked here are all from Europe and it is pretty clear that the sea level in that region has been rising for the last 200 years. It would be interesting to see what the longer term sea level has looked like. In particular, are there any long term cyclical trends that take place over thousands of years. Such data may exist, I looked at a handful of the top sources that came up when searching for information and as stated in the opening I am not an expert in this field. There are some interesting complications such as the post-glacial rebounding that can make it difficult to discern what is really happening. I should also point out that I did not look at the evidence for what was causing the rise in sea level. Of course, the general explanation is melting ice sheets as well as just the expansion of water due to warmer oceans. At some point I'll have to look at the evidence for the actual temperature changes, but most importantly (to me at least), it looks like climate change will be an interesting topic to explore.
A number of my relatives have recently taken an interest in global warming and wanted my opinion on the matter because I was the "scientist" in the room. My general answer is to just point to the scientific consensus and state that I provisionally accept it without being aware of all of the details. The EPA provides a summary of evidence for climate change and in particular a page describing the current state of knowledge. This put me at odds with them suggesting that global warming is some sort of conspiracy and that there is no real evidence. I couldn't really tell whether they disagree that the earth is warming or whether they just disagree that human activity is causing or at least contributing to it. The only thing that really seemed consistent in their arguments was the certainty that they were right and that nothing needed to be done to rectify the situation. Of course, I lost the debate because my typical retort was "I don't know." I haven't spent much time looking into global warming so I'm not that well versed on the evidence to support it.
Anyway, there were a number of questions that came up and for my own curiosity I wanted to know the answer. For this particular post, the question I want to look at is: what do we know about changes in the sea level? This question comes up in the context of global warming because melting ice sheets lead to an increase in sea level. My relatives were interested in the doom and gloom reports, but the numbers that caught my eye were the rate of increase since the 1960s:
Global average sea level rose at an average rate of around 1.8 mm per year over 1961 to 2003 and at an average rate of about 3.1 mm per year from 1993 to 2003.That is a pretty accurate measurement. Go to the ocean and look at the waves and tides. How would you accurately measure the average sea level? Now consider less obvious sources of problems such as evaporation and how much water gets stuck on land vs returned to the oceans from year to year. These days we use measurements from satellites to help improve the accuracy, but what is the tried and true technique for measuring the sea level?
The answer is the tide gauge. Tide gauges are cool because of the simplicity of the basic mechanism. It is essentially a big pipe with a hole below the sea level to allow water in. The pipe protects the water inside from all of the normal disturbances on the surface such as waves. As the name suggests it will still vary with the tides, but it allows fairly accurate measurement of the high and low tides. If you record this for a long enough time you could work out the average sea level for the location of the gauge as well as how this has changed over time. Place enough of these devices around the world and keep track of the measurements and you can figure out the average global sea level and if there are any discrepancies across the world.
The next obvious question is: with such a simple device how much tide history do we have? Humans have had the technology to make such a device for a long time, especially if you allow for manual measurement instead of various automated schemes that seem to have been developed in the mid to late 1800s with Kelvin's tide gauge. The Permanent Service for Mean Sea Level (PSMSL) has a page listing various long term records with the oldest being from Amsterdam starting in the year 1700. They also provide the data with sea level values relative to the NAP (a fixed reference level frequently used in Europe):

From this data set there is a clear rise in mean sea level starting in the 1800s. The PSMSL site also lists data from Stockholm over the period 1774 to 1984. Does it show the same trend? At first glance the answer is no:

What is going on? How could this record be so different? The explanation I found was from a paper Swedish Sea Level Series - A Climate Indicator and the reason is because the land is rising. Specifically this is known as post-glacial rebound (although glacial isostatic adjustment seems to be the preferred term now) and the land is slowly rising after being depressed by the weight of huge ice sheets that covered the region in a previous ice age. To figure out what the sea level has done we need to remove the trend caused by the rising land. Post-glacial rebound can vary from place to place, e.g., see the paper Measuring Postglacial Rebound with GPS and Absolute Gravity that looks at four sites in North America. That doesn't help me for determining the rate for Stockholm Sweden though. I couldn't find a good data set for showing what the rate of the land rise is, and the sources I read suggest it varies over time. The Swedish Sea Level Series paper mentioned earlier shows a trend, but it isn't clear to me what source they used for the rate. Various sources I have seen suggest the rate is less than 1cm per year now, one example is the description of the lake Mälaren. If I assume a rate of 5mm per year and generate a trend the output looks close to what the Swedish report is showing:


There is also a data provided for Liverpool. For this data set there are two versions: an annual MHW and adjusted MHW. For those that are not aware, MHW is the mean high water measurement. The adjustment is supposed to be described in the associated paper, but I could not find a version of the paper for free online so I don't know exactly what was done. I included both in the graph:

Both the annual and adjusted MHW show that the MHW level is rising. The adjusted value at a slower rate than the raw annual reading, in particular for older measurements. A 2008 paper uses these sources to show a trend in mean sea level from 1700 to 2000. The general trend is that mean sea level has been increasing for the last 200 years.
So what does this tell us? The three data sets being checked here are all from Europe and it is pretty clear that the sea level in that region has been rising for the last 200 years. It would be interesting to see what the longer term sea level has looked like. In particular, are there any long term cyclical trends that take place over thousands of years. Such data may exist, I looked at a handful of the top sources that came up when searching for information and as stated in the opening I am not an expert in this field. There are some interesting complications such as the post-glacial rebounding that can make it difficult to discern what is really happening. I should also point out that I did not look at the evidence for what was causing the rise in sea level. Of course, the general explanation is melting ice sheets as well as just the expansion of water due to warmer oceans. At some point I'll have to look at the evidence for the actual temperature changes, but most importantly (to me at least), it looks like climate change will be an interesting topic to explore.
Saturday, August 20, 2011
Calendar woes
The first bit of Calendar nonsense I encountered today was some spam that a family member felt compelled to forward. The message was:
So clearly the July "Money Bags" month is nothing special. Hopefully posting it on the internet and mocking the message will also bring money my way in 4 days via the awesome power of Chinese scented bullshit. Their next claim is a rigged math test that is supposed to be 111 for everyone in the world. Unfortunately, they seem to have forgotten that a few people have been born after the year 1999, and for those individuals the result will be significantly less than 111. Also, according to wikipedia there are a few people still alive that were born in the 1890s and they will get a number considerably higher than 111.
Well that's enough criticism of the spam email. The second bit calendar fun was from the reference site I used for the end of the world post. It has a number of errors in the description of common mistakes made by those predicting the end of the world. The description provided is:
This brings us to the most glaring mistake, that is the claim that the Julian year was 360 days. The Julian calendar has 365 days and calls for a leap year every 4 years making the average length 365.25 days. In fact, the primary change with the Gregorian calendar is to fix some of the long term drift that occurs because the actual number of days in a solar year is about 365.25 days - 11 minutes. Do the math, 24 hours / 11 minutes is approximately 131. That means that after 131 years the Julian calendar will be off by a full day. After 393 years the calendar would be off by 3 days. In the Gregorian calendar the rules for leap years were changed to be years divisible by 4 unless the year is divisible by 100, but if the year is divisible by 400 it is still a leap year. This correction is still not exact, but it does a better job than the Julian calendar. I'm just guessing, but maybe they were thinking of the Egyptian calendar that did have 360 days.
It should be pointed out that these errors don't change their premise. If anything their position is reenforced as the there are many more complexities than they indicated. History is messy, and this includes the history of how we measure and record the time.
Money bagsOkay, so we are now well into August so why am I getting this crap touting how special July was? Well I have given up trying to explain to certain relatives that any mail with the phrase "send to everyone you know" is worthless garbage, but then again I'm enough of a loser to actually read through some of this tripe so I guess I can't complain too much. The first claim is about how special the so called "Money Bags" month is and that it only occurs every 823 years. This immediately strikes me as being wrong. A year is usually 365 days and 365 mod 7 is 1. So if we ignored leap years, then the first of July would return to the same day of week every 7 years. I was too lazy to do the math to see when this would occur and factor in the leap years, that is what computers are good for:
This year, July has 5 Fridays, 5 Saturdays and 5 Sundays. This happens once every 823 years. This is called money bags. So, forward this to your friends and money will arrive within 4 days. Based on Chinese Feng Shui. The one who does not forward.....will be without money.
Kind of interesting - read on!!!
This year we're going to experience four unusual dates.
1/1/11, 1/11/11, 11/1/11, 11/11/11 and that's not all...
Take the last two digits of the year in which you were born - now add the age you will be this year,
The results will be 111 for everyone in whole world. This is the year of the Money!!!
The proverb goes that if you send this to eight good friends, money will appear in next four days as it is explained in Chinese Feng Shui.
Those who don't continue the chain won't receive.
Its a mystery, but it’s worth a try. Good luck
$ gseq 2011 2025 | xargs -I'{}' cal 7 '{}' | grep -B2 -A5 '1  2$'
     July 2011
Su Mo Tu We Th Fr Sa
                1  2
 3  4  5  6  7  8  9
10 11 12 13 14 15 16
17 18 19 20 21 22 23
24 25 26 27 28 29 30
31
--
     July 2016
Su Mo Tu We Th Fr Sa
                1  2
 3  4  5  6  7  8  9
10 11 12 13 14 15 16
17 18 19 20 21 22 23
24 25 26 27 28 29 30
31
--
     July 2022
Su Mo Tu We Th Fr Sa
                1  2
 3  4  5  6  7  8  9
10 11 12 13 14 15 16
17 18 19 20 21 22 23
24 25 26 27 28 29 30
31
Well that's enough criticism of the spam email. The second bit calendar fun was from the reference site I used for the end of the world post. It has a number of errors in the description of common mistakes made by those predicting the end of the world. The description provided is:
An untold number of people have tried to predict the Lord's return by using elaborate time tables. Most date setters do not realize mankind has not kept an unwavering record of time. Anyone wanting to chart for example 100 BC to 2000 AD would have contend with the fact 46 BC was 445 days long, there was no year 0 BC, and in 1582 we switched from Julian Years (360 days) to Gregorian (365 days). Because most prognosticators are not aware of all these errors, from the get go their math is already off by several years.The basic idea is correct, that is there have been many calendars over time and the nuances of those calendars makes it very difficult if not impossible to determine exactly when recorded events happened. So it is true that 46 BC was 445 days long because of accumulated errors in the Roman calendar. However, it fails to mention that 45 BC was the first year that the Julian calendar started getting used. It is also true that there is no 0 year in either the Julian or Gregorian calendars and that some Catholic countries adopted the Gregorian calendar in 1582, but adoption was a long process that took hundreds of years. For example, Greece did not adopt the Gregorian calendar until 1923.
This brings us to the most glaring mistake, that is the claim that the Julian year was 360 days. The Julian calendar has 365 days and calls for a leap year every 4 years making the average length 365.25 days. In fact, the primary change with the Gregorian calendar is to fix some of the long term drift that occurs because the actual number of days in a solar year is about 365.25 days - 11 minutes. Do the math, 24 hours / 11 minutes is approximately 131. That means that after 131 years the Julian calendar will be off by a full day. After 393 years the calendar would be off by 3 days. In the Gregorian calendar the rules for leap years were changed to be years divisible by 4 unless the year is divisible by 100, but if the year is divisible by 400 it is still a leap year. This correction is still not exact, but it does a better job than the Julian calendar. I'm just guessing, but maybe they were thinking of the Egyptian calendar that did have 360 days.
It should be pointed out that these errors don't change their premise. If anything their position is reenforced as the there are many more complexities than they indicated. History is messy, and this includes the history of how we measure and record the time.
webkit2png
If you use Mac OS and ever need to create an image of an html page, then take a look at webkit2png. It is a simple python script that uses webkit to generate a png image of the whole webpage as it is rendered in a browser. You can see an example of the results by looking at my recent scaladoc example post.
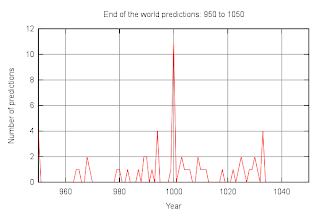
The world is going to end!
Though probably not anytime soon. I found a site listing 242 dates for the end of the world. Not sure how accurate the list is, if nothing else I'm sure they missed a few predictions. For my purposes I was curious how the number of predictions varied over time. The site mentioned above was the best list I found in an easy to parse format with a large number of predictions. The authors of the site state that making end of the world predictions is ludicrous because of Mark 13:32. I prefer the simpler explanation that there is no evidence for the ridiculous claims being made.
 It looks like a fair number of the predictions put the end of the world on a 500 year boundaries. In particular there are spikes at year 1000 and year 2000. Below are close up graphs for those periods:


Monday, August 15, 2011
Scaladoc wiki syntax
I was having some trouble getting the scaladoc wiki syntax to work properly so I finally spent some time and read through the code to learn the quirks. Since I prefer examples to lengthy explanations, I'm posting the reference example I used for testing along with a screen shot showing the actual rendering. So here is the example markup:
The generated output with 2.9.0.final looks like:

/**
 * Example of using scaladoc wiki syntax. I use this example to make sure
 * [[https://wiki.scala-lang.org/display/SW/Syntax scaladoc syntax page]]
 * examples actually work. In particular, I could not get the wiki syntax lists
 * to work based on the documentation.
 *
 * This is another paragraph (note the empty line above) containing '''bold''',
 * ''italic'', `monospace`, __underline__, ^superscript^, and ,,subscript,,
 * words. This sentence uses the inline elements specified in the section
 * "Inline elements" on the syntax page that are sometimes different from the
 * example for _italic_, *bold*, +underline+, {{monspace}}, ^superscript^, and
 * ~subscript~. Why are there multiple ways of specifying the same format?
 * Apparently there aren't, the ones from the inline elements section do not
 * work.
 *
 * == Inline elements ==
 * This section contains a correct listing of inline elements. It is also a
 * handy example of an unordered list as well as escaping.
 *
 *  - '''Italic''': `''text''` becomes ''text''.
 *  - '''Bold''': `'''text'''` becomes '''text'''.
 *  - '''Underline''': `__text__` becomes __text__.
 *  - '''Monospace''': use backticks, I couldn't figure out how to escape
 *    other than sticking something in an inline monospace section, `text`.
 *  - '''Superscript''': `^text^` becomes ^text^.
 *  - '''Subscript''': `,,text,,` becomes ,,text,,.
 *  - '''Entity links''': `[[scala.collection.Seq]]` becomes
 *    [[scala.collection.Seq]]. As far as I know there is know way to link to
 *    external scaladoc so this is useless except for linking to other classes
 *    in the same build.
 *  - '''External links''': `[[http://scala-lang.org Scala web site]]` becomes
 *    [[http://scala-lang.org Scala web site]].
 *
 * == Block elements ==
 * Paragraphs should be obvious by now, just include a blank line. So lets move
 * to code blocks with a simple fibonacci example:
 *
 * {{{
 * def fib(n: Int) = if (n < 2) n else fib(n - 1) + fib(n - 2)
 * }}}
 *
 * Headings are pretty straightforward, lets show some examples:
 * =h1=
 * Note that the default style for h1 makes it some white color with a drop
 * shadow that is difficult to see in the main body of the documentation.
 * ==h2==
 * ===h3===
 * ====h4====
 * =====h5=====
 * ======h6======
 *
 * == Lists ==
 * There is an example unordered list for the inline elements. This example will
 * be more gratuitous and try the various list types that are supported. I must
 * be an idiot because I couldn't figure out how to make unordered lists work
 * without looking at the scaladoc source code. Now it seems rather obvious
 * from the instructions. The problem I had was the "`$` is the left margin"
 * bit. I kept trying to include a `$` in the code to now avail. The other
 * problems is that the first whitespace after the `*` is ignored. However,
 * I still contend that with a simple example it would have been obvious right
 * away, so here are some list examples that have been tested and actually
 * generate a list:
 *
 *  1. item one
 *  1. item two
 *    - sublist
 *    - next item
 *  1. now for broken sub-numbered list, the leading item must be one of
 *     `-`, `1.`, `I.`, `i.`, `A.`, or `a.`. And it must be followed by a space.
 *    1. one
 *    2. two
 *    3. three
 *  1. list types
 *    I. one
 *      i. one
 *      i. two
 *    I. two
 *      A. one
 *      A. two
 *    I. three
 *      a. one
 *      a. two
 *
 * I didn't see it mentioned on the document but you can also add a horizontal
 * rule with 4 dashes. See hr below:
 *
 * ----
 *
 * Ok now a brief look at supported javadoc tags. `@code` gets mapped to
 * inline monospace, e.g., {@code testing}. `@docRoot` and `@inheritDoc` are
 * mapped to empty strings. `@link`, `@linkplain`, and `@value` are also mapped
 * to inline monospace, e.g., {@link link}, {@linkplain linkplain},
 * {@value value}. Note it seems linkplain is confused with link. `@literal`
 * just dumps the value in without modification, e.g., {@literal some value
 * '''in a literal''' that __will__ get wiki formatting}.
 *
 * @author subnormal numbers
 * @see scala.collection.Seq
 */
object Example {
   /**
    * Adds two integers.
    * @param v1  actual parameter
    * @param v2  actual second parameter
    * @param v3  garbage, but no warning :(
    * @return  sum of two integers
    * @throws java.io.Exception also garbage, but no warning
    * @since 1.5
    * @todo do something useful
    * @deprecated
    * @note a profound note
    * @example add(2, 2)
    */
   def add(v1: Int, v2: Int): Int = v1 + v2
}

Sunday, August 14, 2011
Basic coding question
When interviewing candidates I always like to include a basic coding question. The goal is to have something simple that can be done in just about any language to see if the candidate can actually write code. When I used to interview C programmers the question I used was to implement the strtok function. This function useful because you can then follow up with questions about memory management, modifying the input parameters, thread safety etc.
These days, I mostly interview Java programmers, but I still use string tokenization as the basic question and follow up with questions about such as regular expressions and unicode. One of the things that has always surprised me is the amount of variety in the answers. It seems everyone can find different ways of tokenizing strings. So when a colleague said that just about all candidates fail trying the same approach to his basic coding question, I couldn't help but wonder why he was seeing such consistency. The question is to write a function that will print a diamond to the console. The function should take a single integer parameter that will be the width of the diamond. The width must be odd or else the function should print an error.
I thought about it for a bit and had a general sketch of a program within about five minutes. Within another five minutes I had a working implementation in python:
So what was the common mistake he was seeing? Apparently most people start out with nested for loops and try to figure out some equations to indicate whether or not there should be an asterisk at position
These days, I mostly interview Java programmers, but I still use string tokenization as the basic question and follow up with questions about such as regular expressions and unicode. One of the things that has always surprised me is the amount of variety in the answers. It seems everyone can find different ways of tokenizing strings. So when a colleague said that just about all candidates fail trying the same approach to his basic coding question, I couldn't help but wonder why he was seeing such consistency. The question is to write a function that will print a diamond to the console. The function should take a single integer parameter that will be the width of the diamond. The width must be odd or else the function should print an error.
I thought about it for a bit and had a general sketch of a program within about five minutes. Within another five minutes I had a working implementation in python:
#!/usr/bin/env python

import sys

def printDiamond(width):
    '''
    Print a diamond to the console. The diamond must have an odd width, if the
    width is even and error will be printed to stderr and the program will exit.
    '''
    if width % 2 == 0:
        sys.stderr.write("ERROR: width must be odd\n")
        sys.exit(1)

    # Print top half of diamond
    numSpaces = width / 2
    numAsterisks = 1
    while numAsterisks <= width:
        sys.stdout.write(" " * numSpaces)
        sys.stdout.write("*" * numAsterisks)
        sys.stdout.write("\n")
        numSpaces -= 1
        numAsterisks += 2

    # Print bottom half of dimaond
    numSpaces = 1
    numAsterisks = width - 2
    while numAsterisks >= 1:
        sys.stdout.write(" " * numSpaces)
        sys.stdout.write("*" * numAsterisks)
        sys.stdout.write("\n")
        numSpaces += 1
        numAsterisks -= 2

if len(sys.argv) < 2:
    print "Usage: %s <width>" % sys.argv[0]
    sys.exit(1)
else:
    printDiamond(int(sys.argv[1]))
(i, j). At this point a lot of candidates just get bogged down trying to figure out the math and never step back to think about whether there is an easier way. I suppose the consistency is just that the basic trap is so easy to fall into for this question.
Subscribe to:
Posts (Atom)